
It's Thursday afternoon and a message from your CEO lands in Slack. It's a screenshot from Meta Ads Manager showing 180 purchases last month. Below it, one line: "Your report said Google drove 240. Shopify says we had 210 orders total. Which is it?"
You know the answer is complicated. You also know that "it's complicated" is not an answer a CEO wants to hear.
For in-house marketers, this moment comes up again and again. The numbers aren't wrong. Every platform reports accurately by its own rules. The problem is that the rules are different, and nobody outside the marketing team knows it.
Every Platform Grades Its Own Homework
Google Ads, Meta, TikTok, Snapchat, and Spotify each count the sales they had a hand in. None of them sees the full path a customer took. None of them are built to share credit with a competitor.
Take one customer. On Monday she hears your Spotify ad on her commute. On Tuesday she scrolls past your TikTok video, and that night she sees your ad on Snapchat. On Wednesday she clicks a Meta ad, browses, and leaves. On Thursday she searches your brand name, clicks a Google ad, and buys.
Your store records one order. Every one of those platforms reached her, so every one of them can report the sale. Five platforms, five conversions, one sale.
Multiply that across a month of overlapping campaigns, and the platform totals will almost always add up to more than your actual orders.
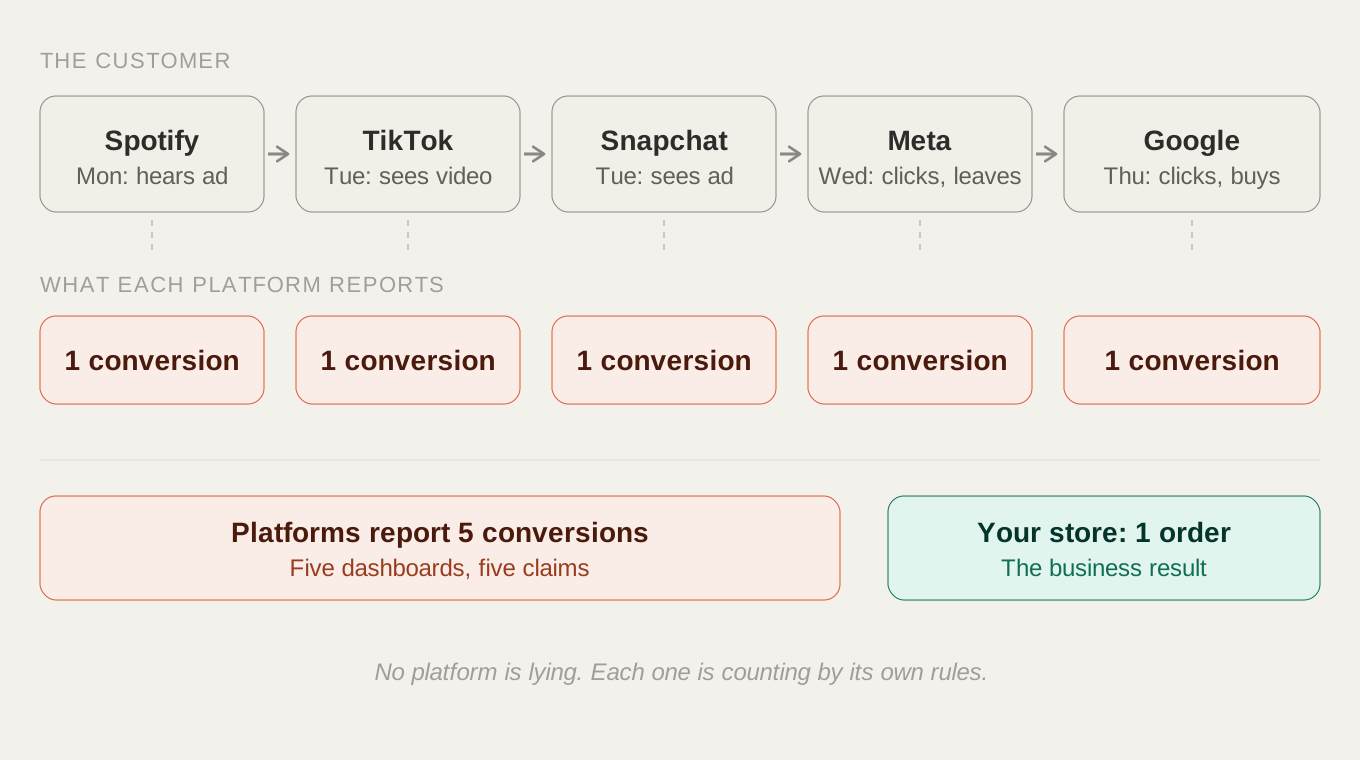
A single purchase can show up as a conversion in every platform the customer encountered. Added together, platform totals overstate real sales, which is why they should never be summed in a leadership report.
More Platforms, Bigger Gap
Most in-house teams don't stay on one or two platforms for long. Search and social come first. Then TikTok for reach, Snapchat for a younger audience, Spotify for audio. Each new channel is a sensible decision.
Each one also adds another dashboard with its own version of the truth. With two platforms, the overlap is easy to explain. With five, the platform totals can add up to two or three times your actual sales, and the screenshot your CEO forwards looks worse every quarter.
None of this means a platform is broken. Each one counts by its own rules, and none of those rules are yours to change.
Pick a Source of Truth Before Anyone Asks
The worst time to explain the gap is when your CEO already doubts the report. The best time is before the first report goes out.
Have one short conversation with leadership and agree on two things. First, which system counts the business result. For most companies, that's the store, the CRM, or the finance system. That number answers "how many sales did we get."
Second, what the platform numbers are for. They are best at comparing performance within a platform: this campaign against that one, this month against last, this creative against the alternative.
Once that's agreed, the Slack screenshot stops being a problem. Meta's 180 isn't competing with Shopify's 210. They answer different questions.
What to Put in the Weekly Update
A weekly update built on that agreement is simple to read and hard to pick apart.
Lead with the business number from your source of truth. Then show each platform's results, clearly labeled as platform-reported. Explain movement rather than totals: Meta's reported CPA rose 18% this week, here is why, and here is what you're changing.
Track the gap itself, too. If the platforms together claim 30% more conversions than your store records and that gap holds steady, that's normal. If it jumps to 60% in a week, something changed. A broken pixel, a new campaign type, a tracking update. The gap becomes a health check instead of an embarrassment.
Your CEO doesn't need the platforms to agree. They need to trust that you know why they don't.
This is also where a lot of in-house time disappears. Pulling five platforms into one spreadsheet, lining up date ranges, and writing the explanation can take a full morning every week.
enso puts Google Ads, Meta, TikTok, Snapchat, and Spotify in one dashboard on the same date range. Its Insights feature writes the plain-English explanation of what moved and why. You check it, add the context only you have, and send it.
Credibility Is the Real Metric
The marketer who explains the gap clearly, before being asked, earns more trust than one who reports a single tidy number and hopes nobody checks.
Disagreeing numbers are a fact of running ads on more than one platform. Being caught off guard by them is optional.
Stop wrangling data. Start acting on it.
enso pulls your ad performance from every platform, analyzes it automatically, and tells you what to do next. Your team gets hours back every week.
More from Reporting
November 6, 2026
For small businesses running paid search and social, two questions matter most: is the money going o...
October 2, 2026
A Senate campaign lost half its Facebook delivery without warning. The lesson for every team running...
June 29, 2026
enso turns scattered ad platform data into the analysis that tells your team what to do next, every...